Business Analytics
Quickly Get Powerful Business Insights & Make Trusted, Smarter Decisions
R Systems’ mission is to employ business analytics for enterprises, to improve their decision-making with meaningful insights.
R Systems empowers business users to quickly discover and gain insights from the business data and helps them to make strategic decisions which yields significant ROI.
R Systems leverages the power of analytics, cutting-edge technologies and best practices to gain actionable insights from the large volume of data across the enterprises.
Our Services Include
Simple, interactive and customized reports to manage your business!
We have in-depth experience developing intuitive, highly interactive and customized reports / dashboards for our clients using technologies like Microsoft Power BI, QlikView and Tableau.
With our deep reporting capabilities, we create comprehensive reports that enable decision makers to visualize the current and the future state of their business.
Customized and Interactive Reports
Prepare customized and interactive reports by analyzing data from disparate sources based on various KPIs allowing organizations to make business decision faster.
Quick Deployment
Transform your complex set of data from multiple sources into visual BI reports.
Refine and Update Outdated Reports
Enrich your reports with real-time data and discover new insights anywhere and anytime.
Automate Reports
Speed up the task of generating reports by automating it on a daily, weekly, monthly and quarterly basis. Generate reports based on minute increments and allows access to specific users within your organization.
Centralized Reporting
Run and manage your business efficiently with one-stop access to all your critical insights and reports.
Access and visualize your multi-dimensional data faster!
OLAP Cube is a data structure that allows fast analysis of multi-dimensional data.
We design and develop highly scalable and maintainable OLAP Cubes to derive successful business results. We ensure that all the components of your OLAP solution meet the business needs of your organization and allow business users to locate and analyze the information effectively.
We consider the following important factors before developing multi-dimensional information systems:
Understanding the business use cases for OLAP design and implementation
Create a cube and its dependent components, including:
Dimensions
Measures (stored and calculated)
Map the OLAP model to source data
Load data into the dimensions and measures
View the OLAP data
Discover the hidden insights from your business data in a whole new light!
Organizations have access to enormous amount of data generated from both inside and outside. Data visualization allows organizations to uncover hidden opportunities from the large and complex data through a simple and intuitive multi-faceted views.
We combine the power of visual analysis and data sciences to comprehend data in a better form such as image and pictures to gain better insights. Our team of data analysis experts allows you to effortlessly explore data, grasp difficult concepts, uncover hidden patterns, identify trends and discover meaningful insights.
Our end-to-end data visualization solution includes:
Interactive Visualization
Understand your business data and represent it in a visually impactful format that allows your organization to get clarity on the data in a cohesive manner to draw insights from the large volume of information.
Spot Trends
Help you to easily discover latest trends using data visualization which can give your business an edge over the competition.
Recognize Relationships and Patterns
Helps you to present complicated data graphically which in turn enables you to identify relationship amongst data sets.
Integrate and Implement Visualization Tools
Select, implement, configure, and deploy suitable data visualization tools like Tableau and Power BI that enables you to quickly turn massive amounts of raw data into actionable information.
Incorporate the Best Charts
Provides recommendations on the best charts based on your data patterns for better clarity and representation.
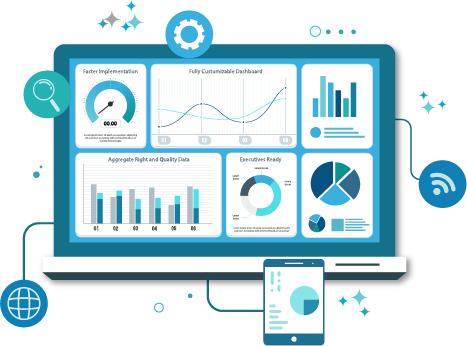
Discover insights from intelligent business dashboard!
We help your organization to easily analyze and visualize growing data sets from disparate sources at one place.
We develop highly detailed and visually appealing dashboards that enable businesses to gain deeper insights and easily uncover rich data correlations.
Fully Customizable Dashboard
Blend, mash, and compare data from multiple sources on a fully-customized dashboard that allows you to visualize your enterprise data at a glance.
Aggregate Right and Quality Data
Derive relevant aggregations of real-time/batch data to help your business gain real value from your dashboard.
Faster Implementation
Build dashboards faster with a seamless process that delivers value right away and allows your business move toward higher revenue, better insights, and data-driven growth.
Executives Ready
Present dashboards in clear logical formats, which help you get into business paraphernalia, which can then be used as a ‘big-picture’ executive summary.